In this article we will discuss, to create chart by programmatically in asp.net. Before preceding this refer part1.
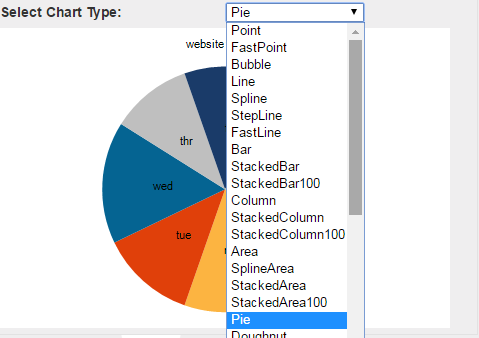
Step 1: create a drowpdownlist and bind chart type name on it and set AutoPostBack to true. We can change chart type as our wish.
Step 2: Copy and paste the following code.
Flowchart.aspx:
    <table style="border: 1px solid #e2e2e2; font-family: Arial">
        <tr>
            <td>
                <b>Select Chart Type:</b>
            </td>
            <td>
                <asp:DropDownList ID="ChartType" AutoPostBack="true" runat="server"
                   OnSelectedIndexChanged="ChartType_SelectedIndexChanged">
                </asp:DropDownList>
            </td>
        </tr>
        <tr>
            <td colspan="2">
                <asp:Chart ID="Chart1" runat="server" Width="450px">
                   <Titles>
                       <asp:Title Text="website visitors">
                       </asp:Title>
                   </Titles>
                   <Series>
                       <asp:Series Name="Series1" ChartArea="ChartArea1" ChartType="point">
                            <Points>
                                <asp:DataPoint AxisLabel="sun" YValues="800" />
                                <asp:DataPoint AxisLabel="mon" YValues="900" />
                                <asp:DataPoint AxisLabel="tue" YValues="700" />
                                <asp:DataPoint AxisLabel="wed" YValues="900" />
                                <asp:DataPoint AxisLabel="thr" YValues="600" />
                                <asp:DataPoint AxisLabel="fri" YValues="750" />
                                <asp:DataPoint AxisLabel="sat" YValues="950" />
                            </Points>
                       </asp:Series>
                   </Series>
                   <ChartAreas>
                       <asp:ChartArea Name="ChartArea1">
                            <AxisX Title="week">
                            </AxisX>
                            <AxisY Title="visitors per day">
                            </AxisY>
                       </asp:ChartArea>
                   </ChartAreas>
                </asp:Chart>
            </td>
        </tr>
    </table>
Flowchart.aspx.cs:
using System;
using System.Collections.Generic;
using System.Linq;
using System.Web;
using System.Web.UI;
using System.Web.UI.DataVisualization.Charting;
using System.Web.UI.WebControls;

public partial class _Flowchart : Page
{
        protected void Page_Load(object sender, EventArgs e)
        {
            if (!IsPostBack)
            {
               GetChartTypes();
               GetChartData();
            }
        }


        private void GetChartData()
        {
            // Retrieve the Series to which we want to addDataPoints
            Series series = Chart1.Series["Series1"];
            // Add X and Y values usingAddXY() method
           series.Points.AddXY("sun",800);
           series.Points.AddXY("mon",900);
           series.Points.AddXY("tue",700);
           series.Points.AddXY("wed",900);
           series.Points.AddXY("Thu",600);
           series.Points.AddXY("fri",750);
           series.Points.AddXY("sat",950);
        }

        private void GetChartTypes()
        {
            foreach (int chartType in Enum.GetValues(typeof(SeriesChartType)))
            {
                ListItem li = new ListItem(Enum.GetName(typeof(SeriesChartType),
                   chartType), chartType.ToString());
               ChartType.Items.Add(li);
            }
        }

        protected void ChartType_SelectedIndexChanged(object sender, EventArgs e)
        {
            this.Chart1.Series["Series1"].ChartType = (SeriesChartType)Enum.Parse(
                typeof(SeriesChartType), ChartType.SelectedValue);
        }
    }
Output:

Post your comments / questions
Recent Article
- How to create custom 404 error page in Django?
- Requested setting INSTALLED_APPS, but settings are not configured. You must either define..
- ValueError:All arrays must be of the same length - Python
- Check hostname requires server hostname - SOLVED
- How to restrict access to the page Access only for logged user in Django
- Migration admin.0001_initial is applied before its dependency admin.0001_initial on database default
- Add or change a related_name argument to the definition for 'auth.User.groups' or 'DriverUser.groups'. -Django ERROR
- Addition of two numbers in django python

Related Article