
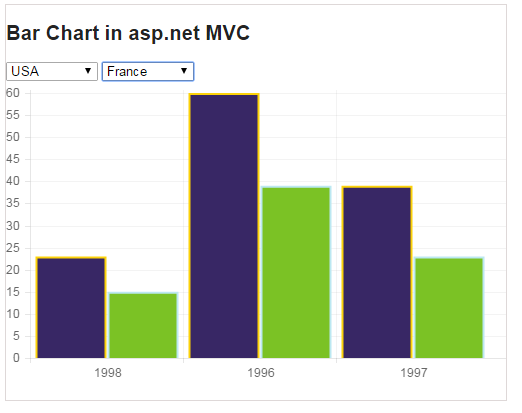
In this article I will show you how to create Bar chart using HTML 5 canvas from database in asp.net MVC c# implemented using chart.js.
It consists of two dropdownlist with list of countries and Html 5 canvas multis-series Bar chart. The chart will compare and display the order statics of two countries. Create an object and fill it with distinct years for x-axis and y-axis create another list objects fill it with order counts of two countries for each year.
The jQuery ajax post call to a controller function GetData() and result the json response and bind the data in the chart using HTML canvas.
Database:
Here I am using Northwind database. You can download it from following link.
Open Microsoft sql management studio and right click on the database and attach it.
Step 1: Create an ado.net entity data model using table orders and generate entity for that.
Step 2: Right clicks on the "Controllers" folder and add "BarChart" controller. Copy and paste the following code.
public class BarChartController : Controller
    {
        // GET: /LineChart/
        models db = new models();
        public ActionResult Index()
        {
            var countries = (from c in db.Orders
                             select new { c.ShipCountry }).Distinct().ToArray();
            ViewBag.ListCountry = new SelectList(countries, "shipcountry");
             var Listcountry = (from c in db.Orders
                               select new { c.ShipCountry }).Distinct().ToList();

            Order order = new Order();
            order.ListCountry = new SelectList(Listcountry, "shipcountry", "shipcountry");
            return View(order);
        }
        public ActionResult GetChart(string country1, string country2)
        {
            string connstring =db.Database.Connection.ConnectionString;
            List<object>chartData = new List<object>();
            string query = "SELECT DISTINCTDATEPART(YEAR, OrderDate) Year FROM Orders";
            DataTable dtYears = GetData(query,connstring);
            List<int> labels = new List<int>();
            foreach (DataRow row in dtYears.Rows)
            {
               labels.Add(Convert.ToInt32(row["Year"]));
            }
           chartData.Add(labels);

           query = "SELECTDATEPART(YEAR, OrderDate) Year, COUNT(DATEPART(YEAR, OrderDate))TotalOrders";
           query += "FROM Orders WHERE ShipCountry = '" + country1 + "' GROUP BY DATEPART(YEAR, OrderDate)";
            DataTable dtCountry1 = GetData(query,connstring);

            List<int> series1 = new List<int>();
            foreach (DataRow row in dtCountry1.Rows)
            {
               series1.Add(Convert.ToInt32(row["TotalOrders"]));
            }
           chartData.Add(series1);
           query = "SELECTDATEPART(YEAR, OrderDate) Year, COUNT(DATEPART(YEAR, OrderDate))TotalOrders";
           query += "FROM Orders WHERE ShipCountry = '" + country2 + "' GROUP BY DATEPART(YEAR, OrderDate)";
           DataTable dtCountry2 = GetData(query,connstring);
           List<int> series2 = new List<int>();
           foreach (DataRow row in dtCountry2.Rows)
            {
              series2.Add(Convert.ToInt32(row["TotalOrders"]));
            }
          chartData.Add(series2);
             return new JsonResult
            {
               Data = new
               {
                   success = chartData,
                   message = "Success",
               },
               JsonRequestBehavior = JsonRequestBehavior.AllowGet
            };

        }

        private static DataTable GetData(string query, string constr)
        {
            DataTable dt = new DataTable();
            using (SqlConnection con = new SqlConnection(constr))
            {
                using (SqlCommand cmd = new SqlCommand(query))
               {
                   using (SqlDataAdapter sda = new SqlDataAdapter())
                   {
                       cmd.CommandType = CommandType.Text;
                       cmd.Connection = con;
                       sda.SelectCommand = cmd;
                       sda.Fill(dt);
                   }
               }
                return dt;
            }
        }

    }
Step 3: Right click on the "Index" action method in the "BarChartController" and add "Index" view. Copy and paste the following code.
@model  MymvcApp.Models.Order
@using MymvcApp.Models;
@{
   ViewBag.Title = "Barchart using HTML 5 canvas from database";
}
<script type="text/javascript" src="http://ajax.googleapis.com/ajax/libs/jquery/1.8.3/jquery.min.js"></script>
<script src="//cdnjs.cloudflare.com/ajax/libs/flot/0.8.3/excanvas.js" type="text/javascript"></script>
<script src="//cdnjs.cloudflare.com/ajax/libs/Chart.js/1.0.2/Chart.js" type="text/javascript"></script>
<script type="text/javascript">
    $(function () {
       LoadChart();
        $("[id*=ddlCountries1],[id*=ddlCountries2]").bind("change", function () {
           LoadChart();
        });
    });
    function LoadChart() {
        var country1 = $("[id*=ddlCountries1]").val();
        var country2 = $("[id*=ddlCountries2]").val();
        var dataobject = {};
       dataobject.country1 = country1;
       dataobject.country2 = country2;
        $.ajax({
           type: "POST",
            url:"@Url.Action("GetChart", "BarChart", new { area = "" })",
           data: JSON.stringify(dataobject),
           contentType: "application/json;charset=utf-8",
           dataType: "json",
           success: function (r) {
                var labels = r.success[0];
                var series1 = r.success[1];
                var series2 = r.success[2];
                var data = {
                   labels: r.success[0],
                   datasets: [
                      {
                            label: country1,
                            fillColor: "#382765",
                            strokeColor: "#FCD209",
                            pointColor: "#FF8C00",
                           data: series1
                       },
                       {
                            label: country2,
                            fillColor: "#7BC225",
                            strokeColor: "#BCE8F1",
                            pointColor: "#0090CB",
                            data: series2
                        }
                   ]
               };
              $("#dvChart").html("");
                 var canvas = document.createElement('canvas');
               $("#dvChart")[0].appendChild(canvas);

                //Fix for IE 8
                if ($.browser.msie && $.browser.version == "8.0") {
                   G_vmlCanvasManager.initElement(canvas);
               }
                var ctx = canvas.getContext('2d');
               ctx.canvas.height = 300;
               ctx.canvas.width = 500;
                var lineChart = new Chart(ctx).Line(data, {
                   bezierCurve: false
               });
            },
           failure: function (response) {
               alert('Therewas an error.');
            }
        });
    }
</script>
<body style="border: 1px solid #DED8D8; width: 500px; height: 395px; font-family: Arial;">
    <div>
        <h2>Bar Chart inasp.net MVC</h2>
        @Html.DropDownList("ddlCountries1", Model.ListCountry)
        @Html.DropDownList("ddlCountries2", Model.ListCountry)
        <br />
        <div id="dvChart">
        </div>
    </div>
</body>
Output:
Post your comments / questions
Recent Article
- How to create custom 404 error page in Django?
- Requested setting INSTALLED_APPS, but settings are not configured. You must either define..
- ValueError:All arrays must be of the same length - Python
- Check hostname requires server hostname - SOLVED
- How to restrict access to the page Access only for logged user in Django
- Migration admin.0001_initial is applied before its dependency admin.0001_initial on database default
- Add or change a related_name argument to the definition for 'auth.User.groups' or 'DriverUser.groups'. -Django ERROR
- Addition of two numbers in django python
Related Article