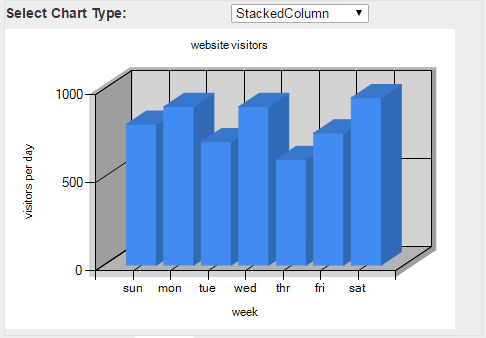
In this article we will discuss, to create 3 dimensional charts in asp.net. It is simple we need to set Enable3D property to true in Area3DStyle. Just see previous tutorial, copy and paste same code just here we need to add property <Area3DStyle Enable3D="True" />
Refer previous link part4
                    <ChartAreas>
                       <asp:ChartArea Name="ChartArea1">
                            <AxisX Title="week">
                            </AxisX>
                            <AxisY Title="visitors per day">
                            </AxisY>
                                <Area3DStyle Enable3D="True" />
                       </asp:ChartArea>
                    </ChartAreas>
Output:

Post your comments / questions
Recent Article
- How to create custom 404 error page in Django?
- Requested setting INSTALLED_APPS, but settings are not configured. You must either define..
- ValueError:All arrays must be of the same length - Python
- Check hostname requires server hostname - SOLVED
- How to restrict access to the page Access only for logged user in Django
- Migration admin.0001_initial is applied before its dependency admin.0001_initial on database default
- Add or change a related_name argument to the definition for 'auth.User.groups' or 'DriverUser.groups'. -Django ERROR
- Addition of two numbers in django python

Related Article