
In this article we will discuss, how to display data using asp.net chart control. We want to display weekly visitors of the website.
Step 1: Drag and drop chart control from the toolbox.
Step 2: Copy and paste the following code.
<asp:Chart ID="Chart2" runat="server" Width="350">
<Titles>
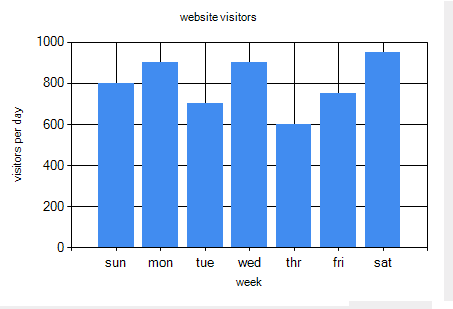
<asp:Title Text="website visitors">
</asp:Title>
</Titles>
<Series>
<asp:Series Name="Series1" ChartArea="ChartArea1">
<Points>
<asp:DataPoint AxisLabel="sun" YValues="800" />
<asp:DataPoint AxisLabel="mon" YValues="900" />
<asp:DataPoint AxisLabel="tue" YValues="700" />
<asp:DataPoint AxisLabel="wed" YValues="900" />
<asp:DataPoint AxisLabel="thr" YValues="600" />
<asp:DataPoint AxisLabel="fri" YValues="750" />
<asp:DataPoint AxisLabel="sat" YValues="950" />
</Points>
</asp:Series>
</Series>
<ChartAreas>
<asp:ChartArea Name="ChartArea1">
<AxisX Title="week">
</AxisX>
<AxisY Title="visitors per day">
</AxisY>
</asp:ChartArea>
</ChartAreas>
</asp:Chart>
In chart we need to provide title for the chart using <Titles>.I There are two main components series & chartAreas.
Series: It is a collection of data points
ChartAreas: we have to provide title for x-axis and y-axis. Here AxisX elements denotes the visitors of website and AxisY for week.
Step 3: Please make sure to register the assembly top of the page.
<%@ Register Assembly="System.Web.DataVisualization,Version=4.0.0.0, Culture=neutral, PublicKeyToken=31bf3856ad364e35" Namespace="System.Web.UI.DataVisualization.Charting" TagPrefix="asp" %>
Run the application and view the output displaying data in a barchart as expected.
Output:
Post your comments / questions
Recent Article
- How to create custom 404 error page in Django?
- Requested setting INSTALLED_APPS, but settings are not configured. You must either define..
- ValueError:All arrays must be of the same length - Python
- Check hostname requires server hostname - SOLVED
- How to restrict access to the page Access only for logged user in Django
- Migration admin.0001_initial is applied before its dependency admin.0001_initial on database default
- Add or change a related_name argument to the definition for 'auth.User.groups' or 'DriverUser.groups'. -Django ERROR
- Addition of two numbers in django python
Related Article